MIT: An AI Simulates Unprecedented Storms
Le brief IA que les pros lisent chaque soir
Les 7 actus IA du jour, décryptées en 5 min. Gratuit.
Inclus dès l'inscription : notre sélection des meilleurs guides & comparatifs IA.
Choisis ton rythme
Gratuit · Pas de spam · Désabonnement en 1 clic
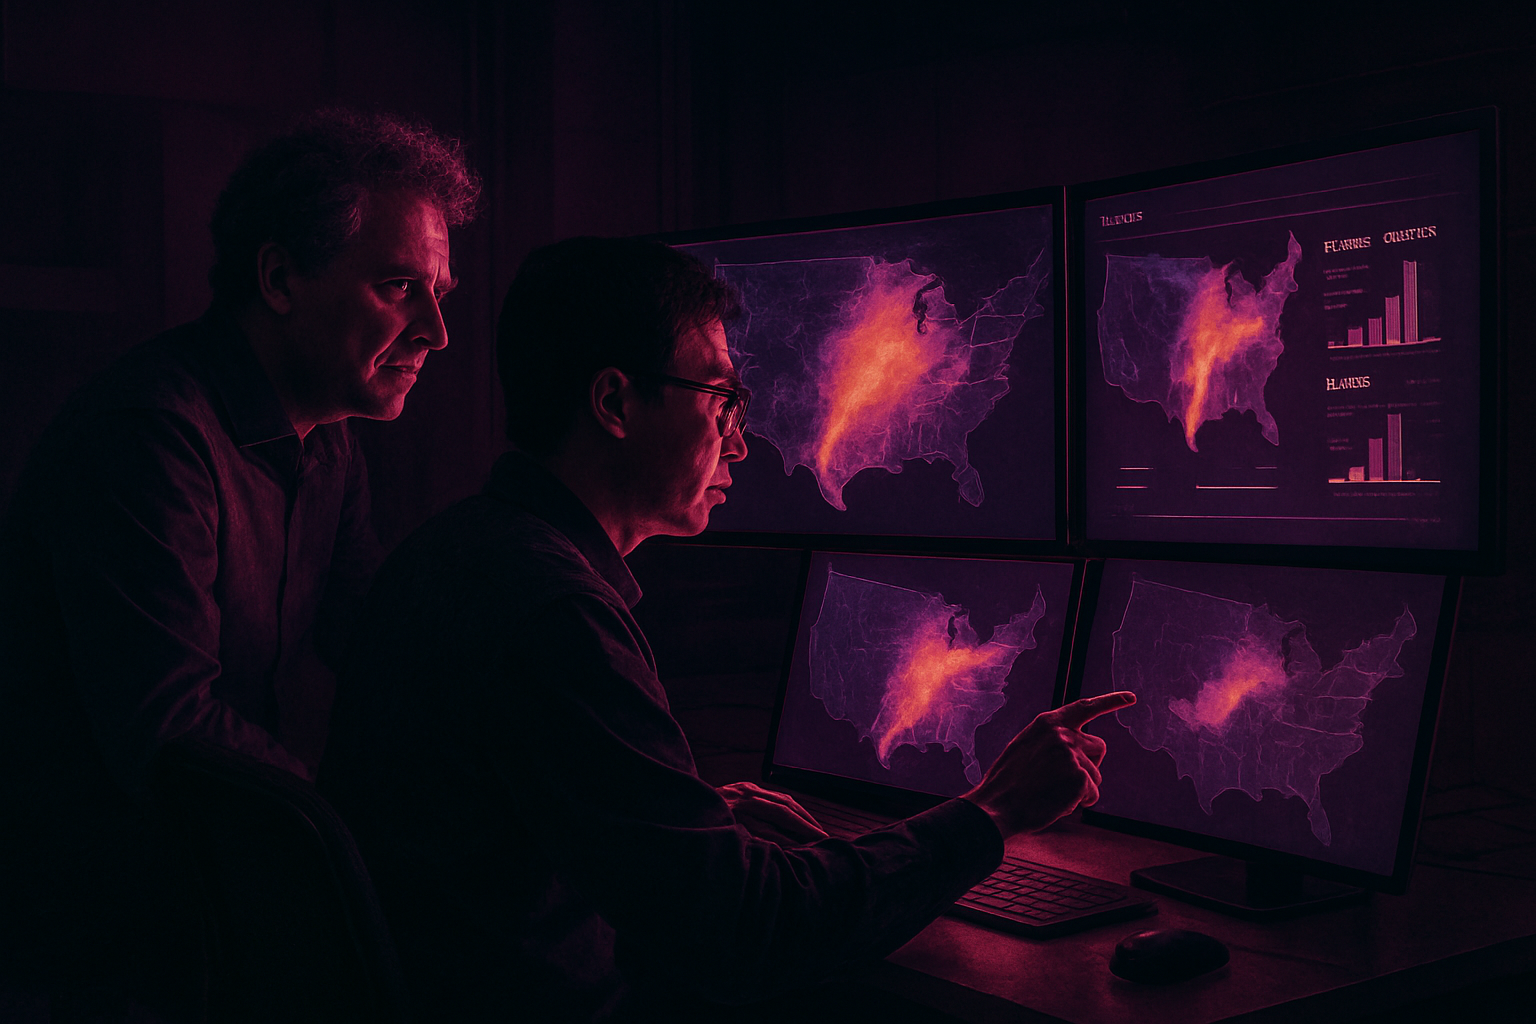
A duo from MIT has proposed an AI capable of producing statistically plausible storm maps beyond anything that has been observed. The approach, published on August 20 in Nature Communications, was tested on 25 years of rainfall data in the United States and can sketch a flood of 300 mm in New York, while the record stands at 200 mm. It also generates the duration, intensity, and probable extent of each scenario to explore "century storms" city by city.
Extreme Scenarios to Test Levees, Networks, and Relief Efforts
A user can ask the algorithm what a century storm would look like for a given city. The output is a series of maps describing statistically plausible storms at that frequency, each with its own size and coverage area, and precipitation intensities that vary spatially. According to Kai Chang, the tool can produce large volumes of these scenarios at once.
These maps are used to explore outlier cases. They are likely to be utilized by a city to analyze the resilience of a seawall against an unprecedented rise in water levels, determine if an electrical grid would withstand a prolonged period of intense heat, or assess whether firefighting resources would be sufficient for a wildfire exceeding all known previous events. In New York, where the maximum recorded rainfall is 200 millimeters, the method is capable of producing coherent maps showing precipitation of 300 millimeters, a level not found in historical data. Each map also provides assessments regarding the duration, intensity, and area affected.
Conditions and Limitations Imposed by Available Data
Applying this to other hazards assumes access to both point statistics and relevant spatial data for the targeted hazard, according to Kai Chang and Themis Sapsis. Extensions are being considered for visualizations of severe flooding and wildfires without historical equivalents, contingent on the availability of these datasets.
Themis Sapsis emphasizes that globally optimized infrastructures for efficiency leave little margin for error. In his view, a unique extreme event can propagate within weeks through supply chains, energy markets, and food systems. Thus, being able to assign a probability to an unprecedented event relates to national and economic resilience.
What the Algorithm Learns from 25 Years of Rain
The method was applied to precipitation measured across the continental United States, using 25 years of hourly data aggregated into daily maps. Initially, the scientists established local statistics indicating how often the maximum precipitation on a map reached different thresholds over the entire study period.
The spatial part of the model was trained solely on low and high-resolution maps extracted from the first six months of these 25 years, a period that includes few, if any, of the most intense precipitation episodes. The algorithm learned the correspondence between low-resolution patterns and high-resolution details, then imposed the point statistics from the complete dataset to bound the extremes of the generated patterns.
At the core of the process, two families of data are statistically linked: point statistics, which quantify the frequency of an intensity level, and spatial maps, which describe the distribution of an impact. This relationship allows for the generation of patterns for events more extreme than anything in the training set, without prior examples of these specific cases.
Team, Publication, and Break from Risk Models
The project is led by Kai Chang, a mechanical engineering student, and Themis Sapsis, who holds the William I. Koch chair at MIT, both affiliated with the MIT Center for Computational Science and Engineering, with Sapsis also holding a position at the Institute for Data, Systems, and Society. Their method, Extreme Event Aware (η-learning), is described in Nature Communications on August 20.
It breaks from practices where models are trained on datasets that already contain extremes to reproduce similar patterns, while decision-makers want to visualize a century storm, location by location. According to Kai Chang, presuming past disasters and attempting to estimate their risk or replay those events limits predictive capacity. Themis Sapsis mentions a "Katrina" that occurs every 30 to 40 years and highlights the need to quantify what a 100-year event would be to help prepare plausible scenarios. The team thus claims to have developed an AI tool for forecasting extremes that does not require historical examples of disasters.
Brief IA — L'actualité IA en français
L'essentiel de l'actualité de l'intelligence artificielle, décrypté et expliqué chaque jour.