Google Gemini: Interactive Visualizations in Chat
Google Gemini and Its Interactive Visualizations
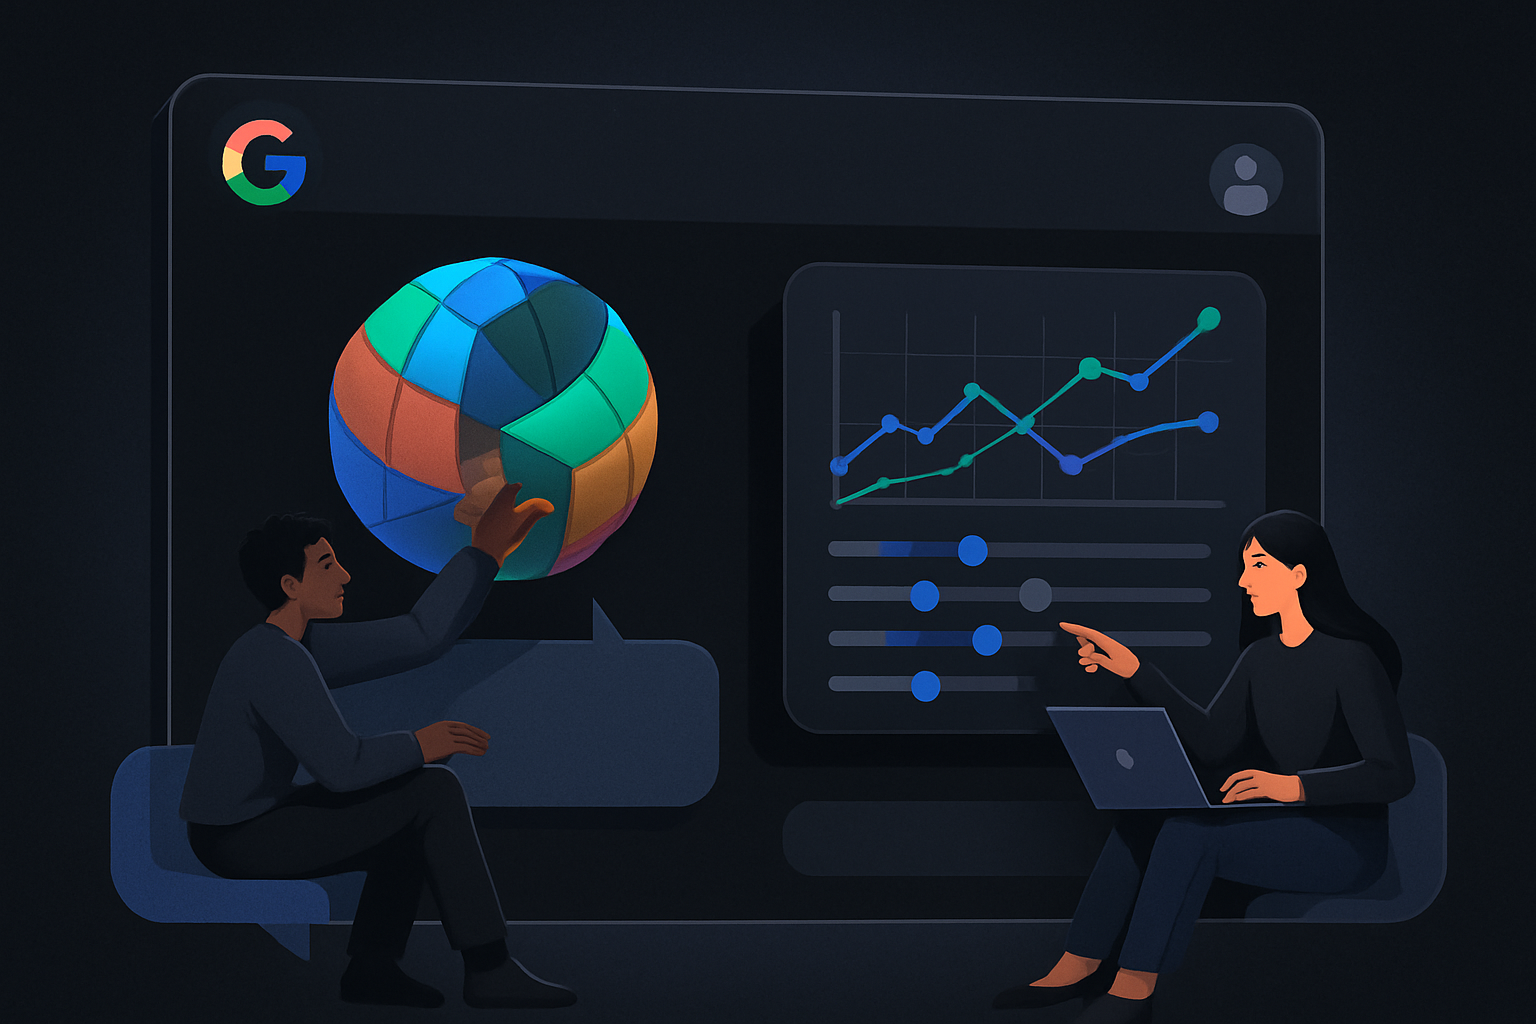
Google Gemini now allows users to transform complex questions and concepts into interactive visualizations directly within the chat. This feature helps users deepen their understanding of content by providing the ability to explore data in real-time.
Users can adjust variables, rotate 3D models, and interact with the visualizations. To try this feature, simply visit gemini.google and select the "Pro" model. Commands like "show me" or "help me visualize" will prompt Gemini to generate a visualization tailored to the topic at hand.
Le brief IA que les pros lisent chaque soir
Les 7 actus IA du jour, décryptées en 5 min. Gratuit.
Inclus dès l'inscription : notre sélection des meilleurs guides & comparatifs IA.
Choisis ton rythme
Gratuit · Pas de spam · Désabonnement en 1 clic
An example prompt could be: "Show me how the responses generated by Google's AI, with a conversion rate of only one percent to sources, drain web traffic."
Similar Feature at Anthropic
Anthropic has already rolled out a similar feature for its chatbot Claude in mid-March. Claude is capable of generating interactive diagrams and graphs in the chat, either when the model deems it relevant or at the explicit request of the user.
These innovations, both at Google and Anthropic, illustrate a growing trend towards integrating interactivity and visual analysis into chat interfaces, thus providing users with more powerful tools to explore and understand information.
Brief IA — L'actualité IA en français
L'essentiel de l'actualité de l'intelligence artificielle, décrypté et expliqué chaque jour.